More proof to test your headlines religiously

Those who have been in direct response already know this, but for the uninitiated, heed this advice: You should spend as much time on your headlines as you do on other creative elements … maybe more!

Below is a terrific example. It’s an A/B test where the only difference in these two pay-per-click (PPC) ads is the headline. One caused 34% more visitors to fill out and submit the lead generation form. The test, conducted over the course of a month to a 99% confidence level, is more evidence to look at headlines as a type of persuasive secret weapon.

With this one set of test results (you can read which was the winner by visiting Anne Holland’s Which Test Won?), the client was able to optimize their PPC lead generation program to a stunning degree. Think of it. They are spending 66 cents on the dollar now for their leads, compared to money spent on the “losing” headline.

So which is it? Find out for yourself. Then remember that every online marketing effort you conduct should be a chance to learn more and reap the savings.

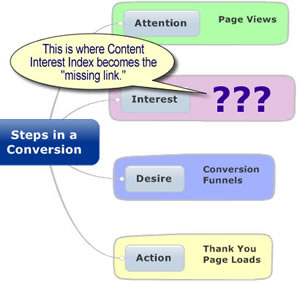
Content Interest Index is the “missing link” in web analytics

Those who have been following me on Jason Fall’s blog Social Media Explorer know that I’ve begun my guest appearances there with a discussion of Content Interest Index (CII). You may also recall from my recent post, Overcoming the treachery of analytics, that I urge web marketers to be ruthless in the elimination of unnecessary metrics from their reporting. That may seem contradictory.

That’s why this post includes a little more information on exactly where the CII comes in handy and how it appears to be unique in doing some important work.

Attention

In a web visit, Attention is measured by Page Views. Each view is evidence of a page commanding user attention. It’s an opportunity to draw the prospect deeper into the sales process. By the way, a “sale” in this instance is defined as any commitment including but in no means limited to the following:

  • Setting an appointment
  • Requesting more information
  • Filling out a request for quote (RFQ)
  • Subscribing to an email newsletter

Interest

Interest is the “missing link,” in terms of what can be quantified within a web visit. Some attempts at measuring this are commonly called engagement metrics. They’re limited in when they can be used. An example of an engagement metric is counting how many people view an embedded video, or tracking how long they stay and watch. Other metrics, such as bounce rates, are better at gauging interest at a session level, not a page level. Content Interest Index (CII) is an attempt to measure interest by tracking a number of user behaviors.

Desire

Desire, defined in this instance, is activity that demonstrates strong buying interest and a high probability to convert. It is the water circling the drain, or — to use a more web-specific metaphor — descent into a conversion funnel. In both online conversions and face-to-face selling, this stage is the answering of objections and a clarification of the real costs and benefits of the commitment. Conversion funnels are fairly easy to configure to track these behaviors.

Action

Action is the fourth and final stage of a sale or conversion, and is as easy to quantify using conventional web metrics as the desire stage. It is the actual transaction. In most analytics systems, conversions are measured when a confirmation page loads, such as a “Thank you for requesting an appointment,” or “… for inquiring,” etc.

Using Content Interest Index to improve content

The primary use of CII is as a content management coaching tool. This is an extremely new metric, but promises to provide insights into raising the “interest quotient” of pages surrounding conversion funnels. In attracting more interest — especially via social media sharing — pages optimized through CII appear to be better at actually feeding visitors into important conversion funnels.

By finally allowing digital marketers to measure every link in the chain to conversion, content interest index has the potential of increasing the number of people entering conversion funnels, and thereby improving the conversion success of the entire web site.

Watch Social Media Explorer for my post early next week on how specifically CII is measured.

Which is better? Google Analytics’ $ Index or CII?

Today I posted my first entry as guest blogger on Jason Falls’ Social Media Explorer. Not surprisingly for those who know me, I kicked things off with a description of Content Index Index — a general description and a case for its use. Posting something in such esteemed company is truly humbling and frankly more thrilling than is probably healthy to admit. (I can hear friends and loved ones chiming in now about all of my work / life balance hoo-hah!)

Content Interest Index — CII for short — forgets for a moment whether a particular user has “converted” in that user session. It scores a page’s content on behavior that takes place on that page only (or offline, regarding that page’s content, in social media). That’s quite different from the scoring of, say, a page in a conversion funnel. Google Analytics (GA) has a Funnel Report that gives value to the pages leading directly to a conversion (Google calls these conversions “Goals”).

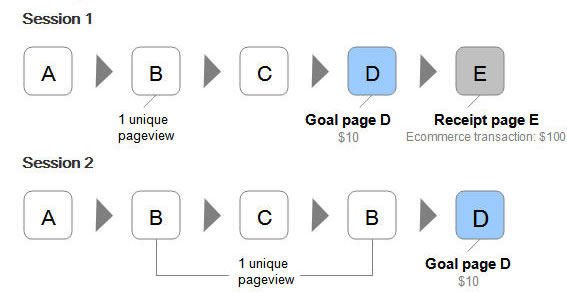
Another GA metric that tries to rank based on conversion is its “$ Index.” This can be compared to Google’s PageRank,  but it’s for estimating dollars earned by a page view, not search engine Google juice conferred by the quality of back links a page receives. It confers a portion of the dollar value of a conversion (Goal) onto pages that were viewed in the same session. Here’s an explanation and some examples (the graphic below is from that post):

Those GA scoring systems are all about the conversion, which I’m usually all for.

But as I mentioned in my post on Jason’s blog site, and yesterday, at a Translator Lab Hours discussion, people “snack” on content. They may come back to your site many times before they convert.

That means the session where they convert is likely to be brief, and the pages viewed (the ones given $ Index value) can be unfairly inflated in value.

Follow me here, and on Jason Falls’ Social Media Explorer, to learn more about how CII is calculated and how it can be used to improve the content on your web site that surrounds your conversion funnels.

Overcoming the treachery of analytics

What do these three quotes have in common?

  • “Worship no false idols” — The First Commandment in the Old Testament
  • “If you meet the Buddha on the road, kill him” — Zen adage
  • “Become a ruthless killing machine when it comes to metrics/data” — Avinash Kaushik in a recent blog post.

If you guessed that they all warn (with increasing violence!) against mistaking the symbol of something for the real thing, congratulations! You won a pipe. Surrealist painter René Magritte painted this particular pipe as a way to get us thinking about the paradox of symbols. Under it he painted a caption, “This is not a pipe.”

To drive his point home, Magritte named the painting, The Treachery of Images.

So how can we know when it’s time to wage war against our own treacherous web analytics? And once the body count has been tallied, what takes their place? What do we use to answer key questions and spur appropriate actions?

Results Simply Summarized

The answer: Show your audience only what they really want to know — not mere numbers and measurements, but the other RSS: results simply summarized. Here’s Avinash’s post for the full story.

And here it is in a nutshell:

He describes a favorite application he downloaded for his Nexus One phone. It’s a cardio trainer. The app starts out just like another popular body monitoring system. I’m thinking of the Nike Plus application for the iPhone. Both give the standard run-down of miles run and progress achieved, compared with past sessions.

The cardio trainer app then makes an elegant attempt at RSS. Avinash, for one, feels that it succeeds. I agree. It refocuses attention past the numbers to the actual workout goal.

At the end of each run, to reflect his level of exertion, Avinash is presented with an award of sorts. The screen shows two pieces of fruit — two pairs. They represent the number of calories burned. The pairs are his to enjoy guilt-free. (Or he can imagine a calorie-laden equivalent, in a mental swap of one food for another. Perhaps the next version of the app will allow users to actually do this; To replace the outline of two pears with a rendering of a candy bar, or a couple of bottles of beer!)
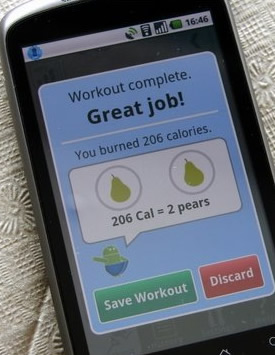
You might think these graphics are the same as Magritte’s pipe — mere symbols; not the real thing. You’d be overlooking a major distinction.

All Magritte was doing was showing the pipe. Avinash’s workout app was presenting the pears — awarding them. It was the summarization of the data behind it, proving to Avinash that this was his hard-won snack. It says, “Here you go. You earned it.”

Connecting On Two Levels

The representation of the pears became something he could connect with — both rationally and emotionally. Unlike Magritte’s pipe, the pears are results, supported by evidence. Consequently, for the recipient, they become so real that person could almost taste them!

Sadly, if most analytics pros were asked to cut out their own distracting and unpersuasive metrics, little would be left. Most metrics talk and talk but never get to the point.

This is precisely what senior management does not want. They want quick and truthful take-aways. Will they be dining on one delicious pear this month, or two? Or will there be none at all?

Of course business leaders wouldn’t want to see pears in their analytics. That would be absurd. So what do they care about? They want to see money of course. Or at least, clear proxies for money. Showing images of people is always good, since selling things to people is the surest path to making money. With that in mind, consider using generic silhouettes of them, shown judiciously, and with data that supports their numbers on the page.

Be bold. Show senior management that their site generated more sales leads this month — as represented by silhouettes of cookie-cutter executives (presumably eager to know more about the product). Count them. How many more are there this month compared to last? Line them up for comparison, month-to-month or year-to-date.

Or, as another example, show how the website is lowering operational costs. Illustrate the success of answering more consumer questions online versus having these people call your pricey phone center. In this case, the graphic could be a string of telephone headset icons. Compared to last month, are there fewer of them shown, or more?

Go on your own metrics killing spree, but first, know what you’re pursuing.

Kill any metric that produces more smoke than light. Allow the remaining metrics to build upon each other and add richness to your story. Then, as a satisfying grace note, find that single graphic which best sums up the current situation. Use symbolic language that is meaningful to your audience, to transcend facts and figures.

Do this, and far from being Magritte’s pipe, this graphic will be your own “Avinash’s pears.”

Does size matter when converting site visitors?

A while back I shared the fascinating “Which Test Won?” case of a former client, Sony Creative Software. Today I played the guessing game with a different type of A/B test. It used Google’s Website Optimizer, an amazing tool for multivariate testing.

The goal of one of the tests, shown below, was to see if the size of a call-to-action influences results.

It does, by an impressive 8 percentage points, but I won’t tell you which was the winner. What I will say is that, this time, my educated guess was dead wrong!

How about you?