Using Google Analytics’ New Report Dashboard

My work with Accenture has meant this blog has been silent since I joined. I’m loving my work there, by the way. But as for the central focus of this blog, I’ve been continuing to have fun in my off hours with web marketing analytics, especially using Google Analytics. If you use this app, you know they’ve launched a major upgrade of their reporting. It includes a way to create custom dashboards. Below you’ll find one small way I’ve used these new custom dashboards to save time and gain valuable insights.

Until I joined Accenture I was one of the contributors to Jason Fall’s exceptional social media marketing blog, Social Media Explorer. I miss being in such terrific company (they haven’t kicked me out of their Facebook group, something I’m very pleased about). I also miss those posts and the greater audience they had afforded me for my ideas on measuring social media.

But all was not well. I had always wondered how often people viewed my posts, the way I can with this blog. Yes, I could see which posts were the most likely to go viral. I could get that like anyone, from this summary of all of my posts there.

Then Jason shared with his contributors full reporting access to his Google Analytics metrics. Heaven!

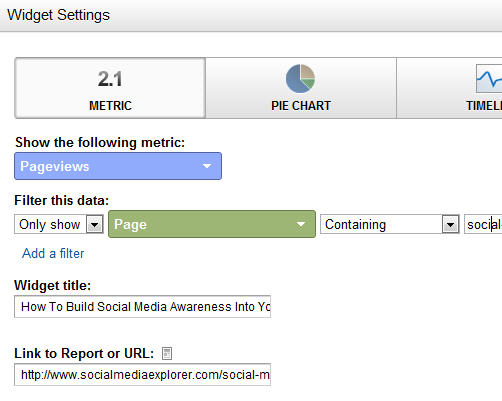
Now I had a different problem: I could see aggregate information, but there was no easy way to view just the information about my pages. If the structure of the site had been, say, “domain.com/jefflarche/blogname,” I could view only the pages starting with /jefflarche/. That’s not the case, though. So I walked away, vowing to someday find a way to create a report that would give me a breakdown of my posts, at least for the KPI of Page Views. I got busy today by creating a new Dashboard for the profile. I then populated it with Widgets. Here you can see what the set up looks like for each widget I added (one per post):

Below are the steps taken in this form:

  1. I chose the widget called “Metric.” This shows one number only (along with a couple of others, for context), instead of a chart, a timeline or a table
  2. I chose the metric of Pageviews. But I needed to add a filter. For that, you can see I chose to only show the count for pages that contain a unique string. For this example, I chose the unique string social-media-awareness-measurement/ portion for this post’s URL
  3. I gave the widget the title of that post and linked to it so reviewing content for hints of popularity (or lack thereof!) would be easier

Pretty easy, no? Once I had added a widget for each, this is what I got:
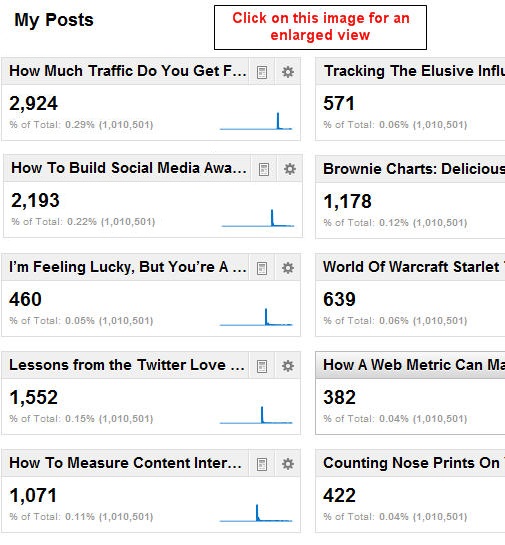
So what insights can I glean from this? First of all, it took a while to build an audience. I learned as I went along, from the first post (lower right corner) to the latest (upper left). I knew this from other measures, which made it particularly sad for me to walk away from the posts. I saw a growth for 693 percent, comparing the views my first post got versus my last.

Turning Information Into Insights

Here are other insights:

  1. People love “how to” content, and respond to headlines that contain those magical words. (I knew this from my direct response days, but it’s cool how thoroughly this has been carried to the online world.)
  2. People like to read reviews of relevant books. That’s what I did with the extremely popular post Lessons from the Twitter Love Guru
  3. Sparklines can give valuable hints to user habits

This last one isn’t readily apparent. I’m going to assume you know what a sparkline is and just say that each of them above shows a sharp rise and fall in readership. After the week it has been posted you can see the view plateau very near zero. It’s to be expected. But there was an outlier, which you could only see if you viewed the full report. It’s shown above right.
Not only did this post not immediately “click” with readers (look at the leading tail), but once it did, its tail at the end is thicker, showing more ongoing popularity. If you’ve been a reader from the start, you’ve already read here and elsewhere about The Long Tail. Here it is in action!

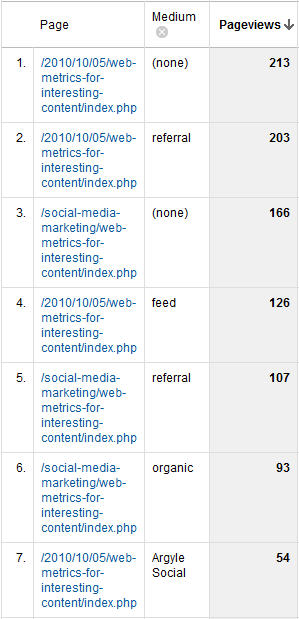
This odd sparkline caused me to dig deeper, and I saw this report for all sources of visits to that page since it post (to the right).

It shows a significant number of links from referring sites and search engines. The referrers obviously liked the content enough to send their readers to it. And search engines? This is the ultimate long tail. I even got four visits from Google for the phrase “measure if people share your content on social media.” Believe it or not, this is hotly contested (I no longer show up for this phrase — at least in the top three pages).

By the way, “feed” stands for Feedburner, which means the fourth (or third, depending on how you look at it) source of visits is people who read Jason’s blog using an RSS reader.

As I said, it pays to be in cool company. By the way, here’s a shout-out to Argyle Social. They’re right near the top as a source for clicks to this page. Their latest post, Is Post Automation Effective? particularly fitting. I would say certainly say yes!

A Link To All of My Social Media Explorer Posts

If the headlines of the above got you curious about my content, I encourage you to visit this summary page, with links to all of them. I’ll be watching this new dashboard to see just how many of you do!
When Virtual Pageviews trump Events

There was much excitement when Google Analytics unveiled its Events metric. This meant web analytics could store several levels of information on a specific action, and associate that information with a unique web visit and visitor. Before that, if you wanted to — let’s say — record a download, you’d need to create a Virtual Page View.

So why did I recently blog on Jason Falls’ site about creating Virtual Pageviews when recording interest actions, such as “Send to a Printer,” or sharing actions, such as “Email a Friend?” or “Share on Facebook?” Why don’t I just create Events?

Using AddThis To Talk To Google Analytics

The answer is simple: If you consider sharing to be a goal of your site, you may want to set it as a Google Analytics (GA) Goal. Events, for all of their power, can’t be set as Goals.

Another action that Events are commonly used for is downloading white papers. Events seem perfect for this because you can set and capture a number of variables, such as title. In other words, you can set the Event Label as the title of the paper. But if you want to measure this as a Goal in GA, you’re out of luck.

Events don’t even “talk” to Goals. [This is no longer true – changes to GA allows any event to be used as a Goal – JL] Let’s say you want to generate a report showing how many people who downloaded a white paper remained on the site for three or more minutes. The time on site can be set as a GA Goal, but you can’t easily generate a report showing the percentage of those who downloaded that remained on the site for that time period.

You can do all of this with GA Virtual Pageviews.

My rule of thumb is this: If you need to identify more than one variable with an event (such as identifying various Actions and Labels), and you do not need to correlate these with GA Goals, used Events. For all else, stick with Virtual Pageviews.

How To Track Content Interest Index In GA Using AddThis

Here is that how-to post I was referring to:

How To Measure Interest Using Google Analytics and AddThis, posted on Social Media Explorer by Jason Falls.

Visualizing bounce rates using brownie charts

Today on Jason Fall’s Social Media Explorer, I discuss my new favorite data visualization technique — one that I’m starting to move into production with web analytics reports I create for clients. Its official name is the Tree Map, but as I mention in that post, I prefer to call it The Brownie Chart.

That post has an example of how I use brownie charts to show a promising new web metric, the content interest index (CII). My example on the site uses a made-up business, Everything Brownies, with a web address of EB.com.

Note: Yes, I know. That web address resolves to a real encyclopedia site. The reason I didn’t just make up a domain name is you never know when one will go live with a site. I didn’t want to have someone inform me, two months from now, that my blog is now pointing to a porn or gambling site! Unless Encyclopedia Britannica takes a surprisingly sleazy turn, I think I’m safe.

Here is another example of how the tree map / brownie chart can make web analytics reporting easier to understand:

Charting Bounce Rates: “I came, I saw, I puked.”

I agree with Avinash Kaushik that bounce rates are a helpful way to measure how well you’re connecting with site visitors. Actually, he’s a little more enthusiastic than I am, with blog post titles such as this model of understatement: Bounce Rate: The Sexiest Metric Ever? Three years ago, on his own blog, Avinash described bounce rates this way:

So what is this mysterious metric? In a nutshell bounce rate measures the percentage of people who come to your website and leave “instantly.”

They’re the one-page visitors. Yes, they might be finding what they were looking for — but more often than not, these people just didn’t dig the neighborhood.

Avinash has refined his description over time. In his recent, truly outstanding book on measuring web traffic, Web Analytics 2.0, he characterizes bounce rates this way: “I came, I saw, I puked.”

Bounces can be reviewed for all traffic to a site, or only for certain important segments — traffic from search engines is a good example. Reporting of bounce rates can also be broken down by page.

The brownie chart becomes particularly handy for this per-page bounce rate reporting. It helps those responsible assess the severity of a site’s problem pages.

You see, you can’t easily be sure that a page with a high bounce rate really is a problem page. Think of it: If nearly everyone ups and leaves when they arrive at a particular page, but that page gets relatively little traffic, there’s no huge emergency. Content management resources are usually scarce, so it’s better to keep looking, for other pages that attract more page views that happen to have comparatively high bounce rates. It’s those more popular pages that require immediate first aid!

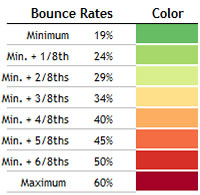
To illustrate, take a look at Everything Brownies’ bounce rates on this brownie chart. The graphic shows all major pages of this fictitious site, and shows the pages as more red if they have the highest bounce rates relative to the others. You should know that size represents the relative numbers of page views. The bigger the “brownie piece,” the more views that page gets.

What does this chart tell us? Quite a bit.

The Holiday Brownie Baking Kit, which I placed my mouse over in this screen capture, has an excellent (i.e., low) bounce rate. It also has a ton of page views.

That means this page is doing quite well in keeping visitors from leaving immediately. Well done! On the other hand, Deluxe Baking Pan is not nearly as successful. Its relative bounce rate is quite high, and because it has the most page views of the entire site, it’s clear this page is majorly dropping the ball!

There are plenty more insights, but you get the picture.

As I mentioned on Jason’s blog, what I like about this charting format is non-math types (such as myself!) can understand these statistics immediately, and know exactly what needs to be investigated further — and in what order of priority. As my friend Bob likes to say, “That’s good stuff!”

I hope you find the potential of this charting technique as exciting at I do.

A Round of Applause for BeGraphic and Sparklines for Excel

This example of a fake report for EB.com, as well as the one on Social Media Explorer, was produced using an “Add-on” for Excel called BeGraphic. The Add-on consists of a whole suite of graphic tools — all based on Excel data and rendered within that application. The particular functions I used were part of Sparklines for Excel within the BeGraphic suite. I urge you to support the folks behind these amazing visualization tools.

Which is better? Google Analytics’ $ Index or CII?

Today I posted my first entry as guest blogger on Jason Falls’ Social Media Explorer. Not surprisingly for those who know me, I kicked things off with a description of Content Index Index — a general description and a case for its use. Posting something in such esteemed company is truly humbling and frankly more thrilling than is probably healthy to admit. (I can hear friends and loved ones chiming in now about all of my work / life balance hoo-hah!)

Content Interest Index — CII for short — forgets for a moment whether a particular user has “converted” in that user session. It scores a page’s content on behavior that takes place on that page only (or offline, regarding that page’s content, in social media). That’s quite different from the scoring of, say, a page in a conversion funnel. Google Analytics (GA) has a Funnel Report that gives value to the pages leading directly to a conversion (Google calls these conversions “Goals”).

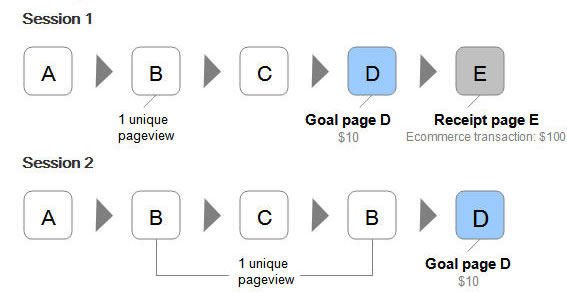
Another GA metric that tries to rank based on conversion is its “$ Index.” This can be compared to Google’s PageRank,  but it’s for estimating dollars earned by a page view, not search engine Google juice conferred by the quality of back links a page receives. It confers a portion of the dollar value of a conversion (Goal) onto pages that were viewed in the same session. Here’s an explanation and some examples (the graphic below is from that post):

Those GA scoring systems are all about the conversion, which I’m usually all for.

But as I mentioned in my post on Jason’s blog site, and yesterday, at a Translator Lab Hours discussion, people “snack” on content. They may come back to your site many times before they convert.

That means the session where they convert is likely to be brief, and the pages viewed (the ones given $ Index value) can be unfairly inflated in value.

Follow me here, and on Jason Falls’ Social Media Explorer, to learn more about how CII is calculated and how it can be used to improve the content on your web site that surrounds your conversion funnels.