Content Interest Index is the “missing link” in web analytics

Those who have been following me on Jason Fall’s blog Social Media Explorer know that I’ve begun my guest appearances there with a discussion of Content Interest Index (CII). You may also recall from my recent post, Overcoming the treachery of analytics, that I urge web marketers to be ruthless in the elimination of unnecessary metrics from their reporting. That may seem contradictory.

That’s why this post includes a little more information on exactly where the CII comes in handy and how it appears to be unique in doing some important work.

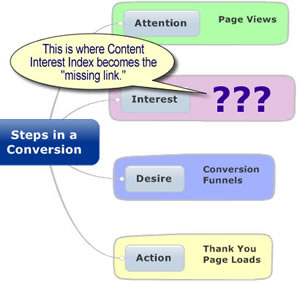
Attention

In a web visit, Attention is measured by Page Views. Each view is evidence of a page commanding user attention. It’s an opportunity to draw the prospect deeper into the sales process. By the way, a “sale” in this instance is defined as any commitment including but in no means limited to the following:
  • Setting an appointment
  • Requesting more information
  • Filling out a request for quote (RFQ)
  • Subscribing to an email newsletter

Interest

Interest is the “missing link,” in terms of what can be quantified within a web visit. Some attempts at measuring this are commonly called engagement metrics. They’re limited in when they can be used. An example of an engagement metric is counting how many people view an embedded video, or tracking how long they stay and watch. Other metrics, such as bounce rates, are better at gauging interest at a session level, not a page level. Content Interest Index (CII) is an attempt to measure interest by tracking a number of user behaviors.

Desire

Desire, defined in this instance, is activity that demonstrates strong buying interest and a high probability to convert. It is the water circling the drain, or — to use a more web-specific metaphor — descent into a conversion funnel. In both online conversions and face-to-face selling, this stage is the answering of objections and a clarification of the real costs and benefits of the commitment. Conversion funnels are fairly easy to configure to track these behaviors.

Action

Action is the fourth and final stage of a sale or conversion, and is as easy to quantify using conventional web metrics as the desire stage. It is the actual transaction. In most analytics systems, conversions are measured when a confirmation page loads, such as a “Thank you for requesting an appointment,” or “… for inquiring,” etc.

Using Content Interest Index to improve content

The primary use of CII is as a content management coaching tool. This is an extremely new metric, but promises to provide insights into raising the “interest quotient” of pages surrounding conversion funnels. In attracting more interest — especially via social media sharing — pages optimized through CII appear to be better at actually feeding visitors into important conversion funnels.

By finally allowing digital marketers to measure every link in the chain to conversion, content interest index has the potential of increasing the number of people entering conversion funnels, and thereby improving the conversion success of the entire web site.

Watch Social Media Explorer for my post early next week on how specifically CII is measured.
Estimating the true value of a web visitor

Marketers are still grappling with finding the real value of digital marketing efforts. At the end of a promotional campaign, marketers find even the most “trackable” of web visits difficult to value. If we didn’t know this already, a survey of chief marketing officers, conducted by Atlanta’s Heidrick & Struggles, clarified the problem.

Kevin Hillstrom, author of Multichannel Forensics, suggests a reasonable way to approach web campaign valuation. It works well for e-commerce site visits, and even sheds light on valuing other types of visitors.

Placing value on non-buying visitors

Start the valuation process with the obvious: Visitors who immediately convert to a sale. But then keep going. Apply common sense numbers to those visitors who do not immediately buy. And why not? Visitors may come back two, three or more times before making a purchase. Like a fish that nibbles before biting, these “lost” visits aren’t so lost after all. They should be fairly depreciated, not totally ignored.

Here’s what Kevin says about ignoring all but the “one-visit” purchasers:

We try our hardest to allocate orders to the advertising vehicle that caused the order, seldom considering a series of events.

Take paid search as an example. Assume that a paid search campaign results in a 3% conversion rate and a $100 AOV [Average Order Value]. We run a profit and loss statement on the 0.03 * 100 = $3.00 demand generated by the campaign, factoring in the cost of the campaign.

What about the 97% of visitors who did not purchase?

Hillstrom asks, “What if you had this data?”:

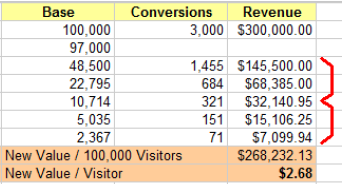
  • Of those who are left [i.e., 97% of the base], 50% will visit the website again within one week, with 3% converting, spending $100 each.
  • Of those who are left, 50% will not visit again. Those who are left will visit again within three weeks, with 3% converting, spending $100 each.
  • Of those who are left, 50% will not visit again. Those who are left will visit again within one month, with 3% converting, spending $100 each.
  • Of those who are left, 50% will not visit again. Those who are left will visit again within four months, with 3% converting, spending $100 each.
  • Of those who are left, 50% will not visit again. Those who are left will visit again within six months, with 3% converting, spending $100 each.

He goes on to explain:

There is value in each case, value that most of us choose not to measure.
When I iterate through the five cases above, I calculate an additional $2.75 of future visitor value. [I get $2.68 in my number-crunching, as the number in the lower right of the graphic shows. Here’s my math in a Google Spreadsheet.]

Value of a Site Visitor Assuming $100 AOVIn other words, we measure the $3.00 generated by short-term conversion. We don’t always measure the $2.75 of future conversions.

Now there may be additional expenses associated with the $2.75 number — that customer might require additional paid search expense or might use a shopping comparison site, whatever. So we need to run a true profit and loss statement on the additional $2.75 generated by future visits.

If each first-time visitor (one that doesn’t convert immediately) is worth $0.30 profit over the next twelve months, you think differently about attracting visitors, don’t you?

I agree. The BrandWeek article I linked to in the first paragraph said that the CMOs surveyed, “Expressed an awareness of digital’s potential, along with a recognition that they weren’t close to tapping it.”

Building sales models that take into account the messy realities of online behavior is one way we can start.

How well are you feeding your web site’s antlions?

Earlier today I spoke at a conference for web marketing professionals in Jacksonville, Florida. My topic was web analytics. It was a well-timed opportunity for me. I used the talk to do these two things:

  1. Discuss the new web metric my team has innovated, called Content Interest Index
  2. Try out a form of condensed slideshow presentation called Pecha Kucha

As I described in a prior post on Pecha Kucha, this is to slideshows what the haiku is to poetry, and Dogma 95 is to film making. It has strict rules designed to bring out the soul of a presentation — especially if you subscribe to the phrase “the soul of brevity.” The rules are that you have exactly 20 slides, and each is up for exactly 20 seconds. That means after 6 minutes and 40 seconds, you come to a full stop.

For those of you as nutty about films as I am, you know that Dogma 95 was borne out of the desire of a handful of directors to treat their audiences like grown-ups. Pecha Kucha may not pretend to be anything loftier than playful fun, but it does respect the audience’s valuable time. How refreshing!

My presentation needed a “hook.” I chose a doozie. I compared a web site’s conversion funnels to the lairs that are built by antlions. These critters were an obsession of mine when I was 10 years old (I even kept one as a pet, in a sand-filled coffee can in my bedroom!).

I frankly could not resist using graphics of the antlion’s traps as ways to illustrate aspects of measuring web conversion. In this elaborate comparison, ants unwittingly encircle the antlion’s lair and some tumble to their doom, in the same way that web visitors cruising around a site’s pages are attracted to offers (the “mouths” of conversion funnels).

Hey, no one ever said marketing was pretty.

The Antlion’s Lair

Yes, this comparison is a bit of a stretch — if not downright grisly — but I do believe I got my point across. Especially with the help of a supplemental presentation, given in mind map format (here is the map, in Acrobat format … watch out, it’s a quite large file at 2,310 KB). My presentation included excerpts from the CII case study that you can download from this blog entry.

Why don’t you be the judge of the job I did in milking this helpless metaphor until it mooed in pain? Download this podcast of my Pecha Kucha (1,724 KB in MP3 format), and check out this PowerPoint player file (324 KB in PPS format) for the visuals. You have to sync up the audio and visual files, but it’s hopefully well worth it. Updated 10/9/07: You’ll find the Pecha Kucha on YouTube.

Let me know what you think, and more importantly, if you think the antlion should be some sort of Web 3.0 mascot. What’s the reasoning behind that suggestion? None whatsoever, except the antlion is a very clever creature.

And hey! What the heck. A creature looking this monstrous really needs a break.

New web metric puts the I in AIDA and helps optimize content

The first marketing class I ever had in college taught me the AIDA model of advertising. It’s still used today, lo these many years later. The AIDA model goes like this: Once you attract Attention, you must generate Interest, create Desire, and enable your market to take Action. Do all of those things and you’re golden.

Back then the only way you could actually measure any of these (except for the last A, which was making a sale) was by employing expensive and time-consuming research. The web changed all that. It allows us to measure each of these steps — except for that pesky thing called Interest.

Until now, the interest that people exhibit in a site’s content has been impossible to accurately measure through current techniques. What has changed? I and my team have come up with a workable solution — a simple way to plug the hole in that famous AIDA acronym.

We’ve found a way to reliably measure web visitor interest.

That’s a bold statement, but here’s why I make that assertion. After analyzing a critical mass of data from the site of one of our largest clients, I can say with confidence that we have a metric that is the rarest of creatures. It is a measurement that arms content managers with real, actionable feedback about the changes they’ve made to web content over which they have responsibility.Of all the content changes year-to-date, those in page #2 were most effective, as measured by CIIThe metric is called CII: Content Interest Index. I’ve been wrong more than once in my career. Sometimes I’ve been wrong in spectacular ways. But I firmly believe from what I’ve witnessed that this is a unique and valuable tool for managers of many types of sites.

The CII is most valuable for those who manage large amounts of product and service information, delivered over a site with a content management system (CMS) handling a ton of impressions. Volume is really key. The biggest constraint of this metric is it requires high levels of traffic to the pages being measured.

The graphic above is a sample from an analysis for a client — who will remain anonymous — who manages that critical mass of traffic I was referring to, and has provided two year’s worth of data to analyze. In the graphic, the CII illustrates to a single content manager how five product pages are doing, this year compared to last. Specifically, it shows that for two of the pages, CII has dropped in real numbers, while in all five cases page views have risen.

These CII comparisons help a content manager optimize pages using real feedback provided directly by the user (through the measurement of two behaviors, as described below). In the hands of the right content manager, CIIs for the pages managed should progressively climb, as a positive feedback loop continues to reward well-targeted content. It’s the equivalent of a public speaker talking to real audiences, and getting real applause (and real yawns), as opposed to merely guessing at what people want to hear by speaking to an empty room.

How is CII Calculated?

As this white paper (a PDF file) on the CII explains, this is a simple metric that can be built into just about any web site. Here is how it is described there:

The CII counts instances of a page’s “Printer Friendly Format” or “Email a Colleague” icon receiving a click. This observes what are arguably the two most common ways that visitors save or share information – either through printing or emailing content. To factor out a page’s level of overall readership, the sum of clicks is divided by page views.

Page views still come into the equation of analyzing CII, and they are excellent measures of the first A of a site’s AIDA. In other words, the number of people who view a page can be a proxy for the amount of attention you have to play with for that page.

As the white paper explains, the D of AIDA can also be measured using existing web metrics, because desire is exhibited as prospects circle your product or service more closely — and more often — investigating things like delivery options, pricing variables and means of payment. And, as with the “real” world, the online marketplace has always measured the A — as in action, well. This is a transaction.

That leaves interest as something without a good yardstick. Until now.

Check out my white paper and feel free to adopt the system on your own site.


I’d like to extend a special thank you to all of my marketing and technology friends and colleagues who have helped by commenting on drafts of this white paper. Your help has been invaluable.